- Reporting and analytics tool provides detailed information about purchases – transfers – sales transactions, inventory levels, and customer behavior.
- Track trends over time and identify opportunities for improvement. Help businesses optimize their operations and make informed decisions about pricing, promotions, and product mix.
Table of Contents
- 1 Access Reports and Data From AnyTime – AnyWhere
- 2 Time Filters in Reporting and Analytics Tools
- 3 7 Report Types of Reporting and analytics tool in Sivib POS Software
- 4 Reporting Analytics Tool – Key Features of Summary
Access Reports and Data From AnyTime – AnyWhere
- Business owners can check sales across stores: Wherever you are, you can choose to access any store and observe sales – inventory, monitor performance, absorb insights, and make real-time decisions to increase sales and customer satisfaction, with no need to wait for a manager to run a report and email it over.
Time Filters in Reporting and Analytics Tools
- You can now filter the product mix report by time ranges to see how your products are selling during specific times during the day. And find out the difference between expected and actual cash amounts.
- Increase profit margins by analyzing product performance on specific days or times.
- Determine when certain products sell the best and when they sell the worst, and use this information to streamline your marketing and inventory.
- Compare sales by different periods, stores, and employees; check the important parameters, such as gross sales, net sales, gross profit, amounts of refunds made and given discounts.
7 Report Types of Reporting and analytics tool in Sivib POS Software
Sales Reports
These sales reports will show you your total sales for a given period of time, as well as your average sale amount. This information is essential because it can help you track your sales goals and see if you are meeting them.
The sales KPIs you should be tracking with your sales reporting and analytics tool:
- Total sales: An in-depth look at purchases and returns.
- Daily sales: Each day’s purchases and returns are noted.
- Discounts and voids: Information regarding the number of discounts and voids that occurred during service.
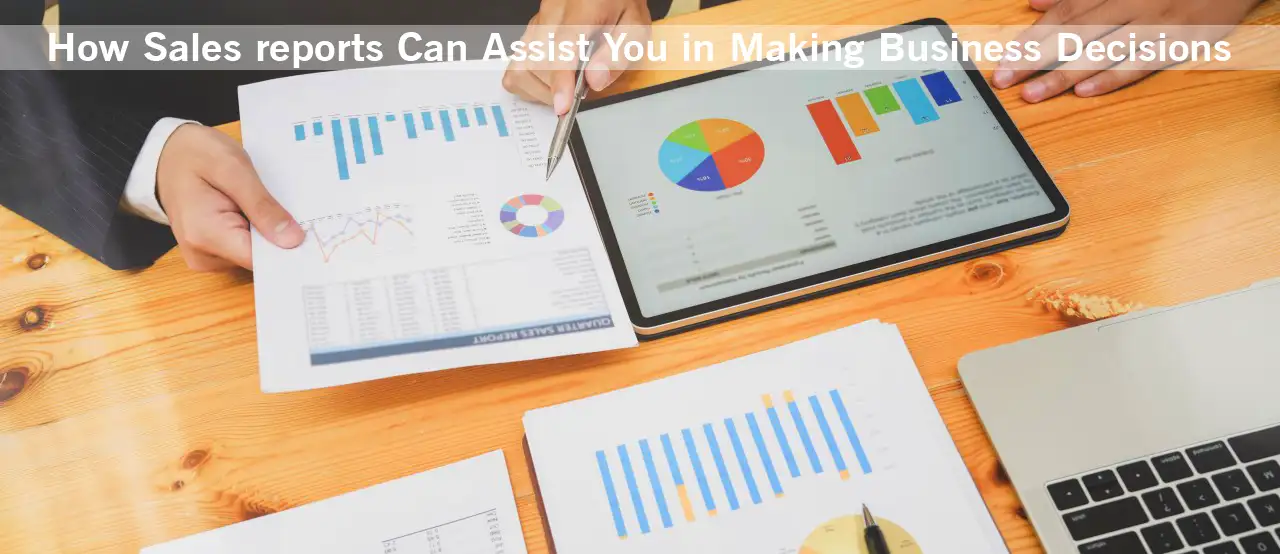
How Sales Reports Can Assist You in Making Business Decisions
- With the sales and shift reports, you can see how much profit is made, net and gross sales of all your stores, and which employees are making the most sales at specific times in order to apply resources where necessary better to increase business.
- Determine top-selling items and categories, top-performing employees, busier weekdays, and stores with the top sales. And therefore, the right purchasing decisions can be made.
- Sales per product category, sales per item, sales per customer, sales volume per day or month, sales in peak hours, and similar other reports to understand customer behavior.
- Track the sales growth or decline compared with the previous day, week, or month, and promptly react to changes.
- To inform product placements, plan profit margins, schedule store timings, etc.
- Track sales trends and react to changes promptly.
- You can check retail analytics, like which are the top 10 product categories show the most sales.
- Compare Sales and Sales Returns for various stores.
- Item Expiry Report: Manage the priority of items that they need to sell. Using it, you can even strategize on which products you need to run promotions for clearing the stock.
Shift Reports
- If you want to see similar information as displayed on the store report but hone in on a specific shift rather than a whole day, week, month, or another extended period, you can do that with the shift report. This report gives a detailed of everything that occurred during a given shift. This report can provide insight into individual employees’ performance and how sales fluctuate by time of day.
Learn more about Point of sale – POS billing software and Wholesale management system
Inventory Reports
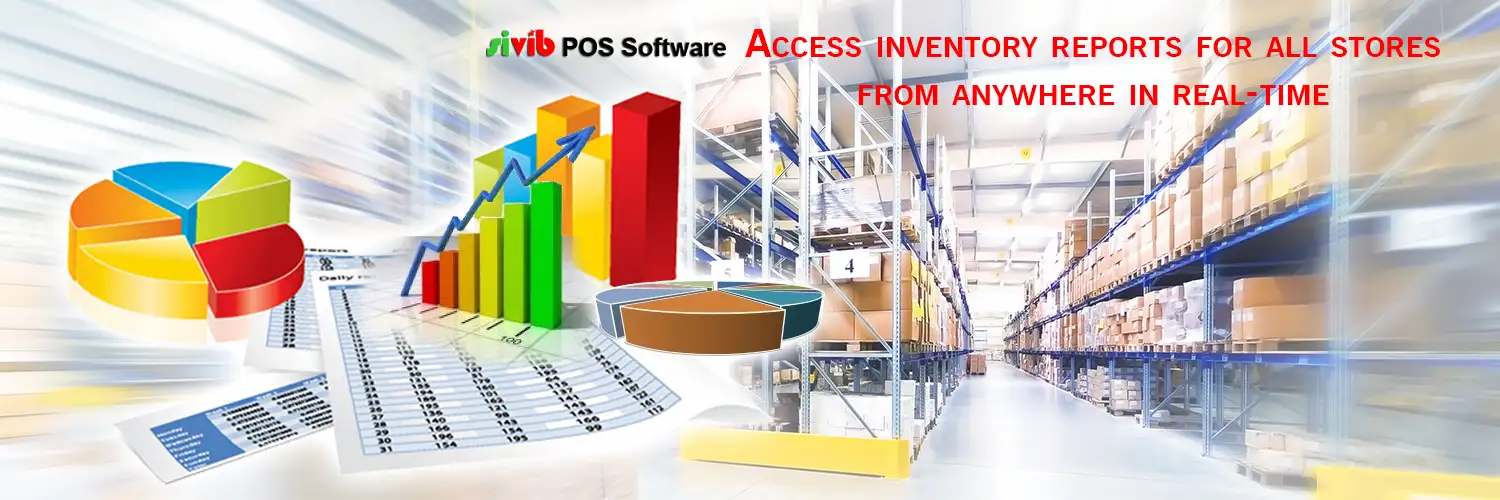
- The inventory’s reporting analytics tools will show you what items are in stock and how many of each item you have on hand. You can analyze which items are causing you to lose or gain the most money and then adjust your stock accordingly to increase profits.
- Get the exact data of your hot and low-selling items.
- View the Store Transfer Reporting Tool for info on all items transferred from one store to another during a specified time period.
- Use the Adjustment Reporting Tool to view data on all adjustments to items that occurred in a specific time period as result of them getting lost, broken, stolen, etc.
- The expiry report lets you know about the items and their expiry dates. You can filter the report as per the expiry date and know which items will expire soon.
Learn more about Inventory management system and Multi-store management system
Customer Reports
Contact information and purchase history. This information is essential because it can help you build relationships with your customers and better understand their needs.
Keep track of these data reporting tools to understand your customers better:
- Guest Purchase history: Data about what your customers purchased on each visit, including the time of visit, a staff member who served them, items ordered, cost of items, loyalty points, and gratuity.
- Loyalty program engagement: Get information about your loyalty program, such as how many points customers have earned, what incentives they’ve redeemed, how much they’ve spent, etc.
Use these powerful insights of consumers to:
- Send them marketing offers that they won’t be able to refuse. For example, give a freebie to a consumer who hasn’t bought from you in a while.
- Improve the customer experience. Learn more about customers and their favorite items to surprise customers.
- You can personalize the shopping experience and offer tailored promotions, discounts, and loyalty programs. You can also track customer purchases and see what products they are interested in, which can help you make informed decisions about future promotions and sales.
- You can make informed decisions about product offerings, promotions, and pricing by deeply understanding customer preferences. This leads to higher sales and a more successful business.
Learn more about CRM – Customer management system

Employee Productivity Reports
Give you information about your employees, such as their hours worked and sales totals. These data reporting tools are essential because they help you track your employees’ productivity and see if they are meeting their goals.
To keep the staffing under control, keep an eye on these reporting benchmarks:
- Set daily, weekly, and monthly sales targets for each of your staff, and see how they perform against those objectives.
- Employee shifts: See how long team members worked when they logged in and out, how many shifts they worked, and how much they sold.
- Employee Performance Reports: You can check employee-wise sales data to set performance benchmarks and analyze the most promising employees.
How these Reports Help You Manage Staffing:
- Determining which employees generate the most revenue helps you book them for more shifts and give them raises to keep them.
- You can also assign more staff on busier days and make sales benchmarks transparent for the staff.
Learn more about HR – Employee management system
Vendor Reports
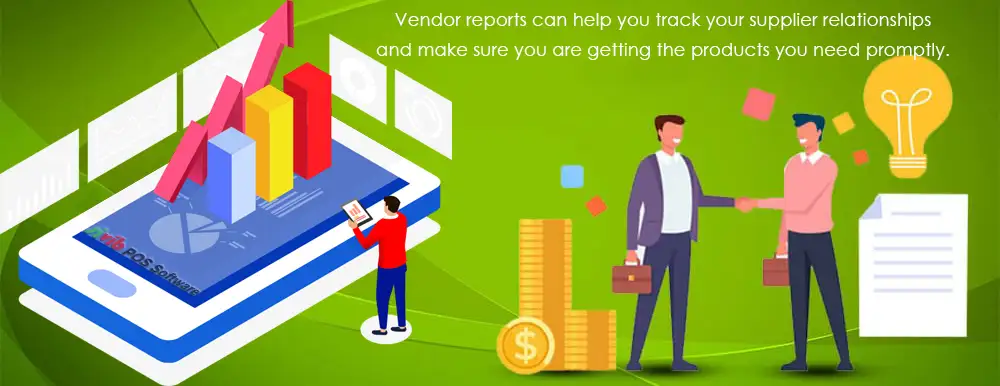
Show their contact information and delivery schedule. This vendor report tool is essential because it can help you track your supplier relationships and ensure you are promptly getting the products you need.
Keep a close eye on maintaining control over your products by the vendor:
- Keep a complete and updated catalog of all your suppliers. Easily check all relevant info, such as the transactions of purchased items and the products that you buy from each of them.
- By clicking on the supplier’s name, get a list of all the SKUs assigned to the supplier.
- Total Cost: Each day’s purchases and returns are noted.
How These Reporting Tools Help You Make Business Decisions:
- Inventory Purchase Reports and Purchase History.
- You can choose to process the report for one particular store or the whole chain.
- Payment: See invoices from Vendors and manage payment.
- Average Estimated Margin on Sales for all the products.
Top Product Category and Purchases
- You purchase several products, and ideally, the top-purchased product must be the one that is sold the most.
- Check the purchases made from each supplier directly, listed chronologically. Use the Purchase reporting tools to know for sure which supplier’s products are selling best. This way, you can quote your purchases better and get the best deals!
Learn more about Vendor management system
Payment Reports
These analytics give you a closer look at your customers’ preferred payment methods.
Manage cash flow and balance sheet seamlessly with finance & accounting reports.
To retain control over your finance, watch these reporting benchmarks:
- Payments and refunds: A list of cash and card payment totals and refunds.
- Payments by section: Sales details by payment type and by section.
- Credit card payments: Individual credit card payments and refunds, dates and times cards were used, order numbers, authorization numbers, and amounts paid.
How These Reporting Tools Help You Make Business Decisions:
- Understand customers’ preferred payment methods to upgrade your tech (by offering mobile payments like Apple Pay, for example) or find a card processor that gives you the best deal on processing fees.
- See patterns in refund causes (e.g., chargebacks or accidental double entries) and make changes to avoid them.
- Find out customers’ payment patterns to set card minimums.
- Analyze card usage to decide how many credit card readers you need to meet demand.
- Day-wise Cash Report.
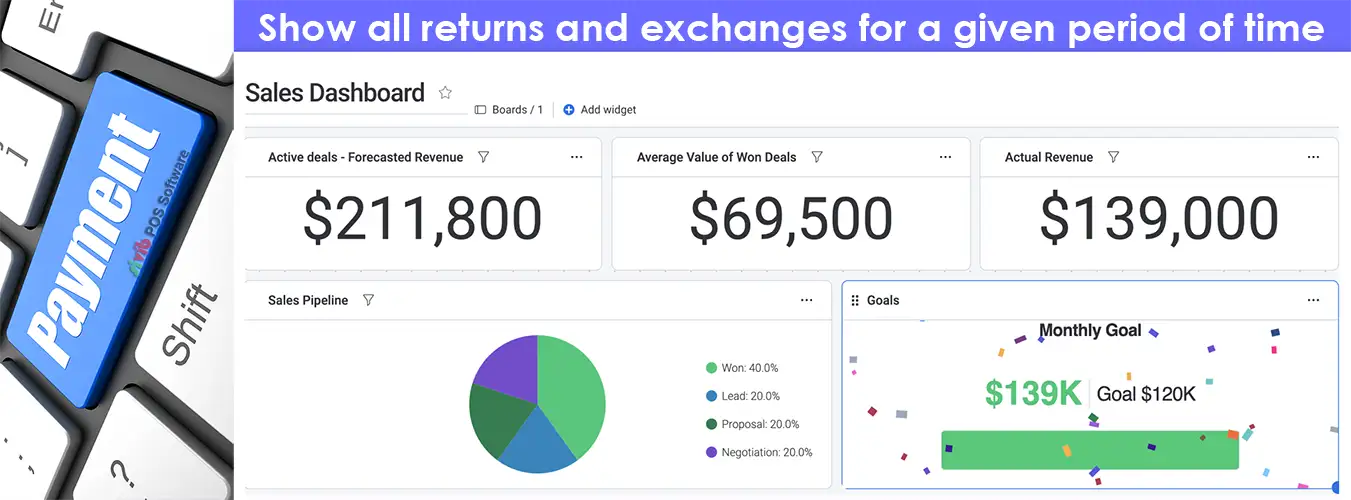
- Show all returns and exchanges for a given period of time.
- The Accounts Payable module tracks money due to vendors, discounts, and payment terms for all invoices.
Marketing & Promotions in Reporting and Analytics Tool
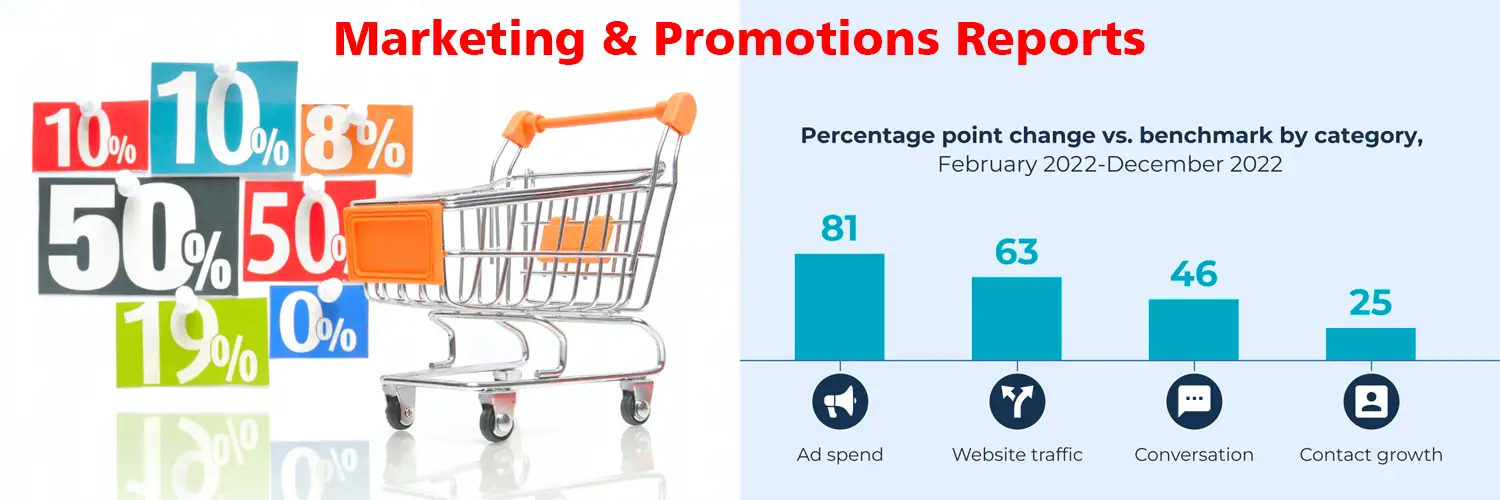
Show increasing in-store traffic, engagement, and sales owing to promotions. This information is essential because it can help you track your marketing progress and see if your efforts are paying off.
To Track Your Marketing Effort:
- Promotions Analysis: While you roll out different in-store promotions, the report analyses the sales and engagement owing to a specific promotional activity.
- Loyalty Report: This report gives you a deeper look at the customer loyalty ratio and the number of repeat sales. You can compare it with the loyalty promotion activities you have employed for your business.
How the Marketing & Promotions Reports Help You Boost Sales:
- Loyalty cards: Influence customers with loyalty cards to continue visiting that particular location for purchases.
- Show all discounts and coupons used for a given period of time.
- Show all gift cards sold for a given period of time.
Learn more about Sales Promotion Program Management – Gift Cards
Reporting Analytics Tool – Key Features of Summary
What would you add as another report in Reporting Analytics Tool?
Let us know in the comments below!
If you have any questions about Reporting and Analytics Tools or suggestions for improvement to existing features. Let us know in the comment below!

